

Try Horopter
Run Horopter on your machine, record a change, and see it in the terminal and on a Grafana graph.
Run Horopter on your own machine, record one change, and see it twice: in the terminal, and in Grafana beside the traffic it caused. CI tests each step below against Horopter v0.14.2.
Prerequisites
- Docker, with Compose 2.23.1 or later.
curlandjq.- Ports 3000, 8080, 8081 and 9090 free on your machine.
- macOS on Apple silicon, or Linux on x86-64 or arm64.
Steps
Choose the Release
Every command below downloads the release this page is tested against, Horopter v0.14.2, except Homebrew, which always installs the latest release. Set it in the shell you will use for the rest of the page, in an empty directory:
export HOROPTER_VERSION=v0.14.2Start the Stack
Download the release's docker-compose.yaml and start it with its grafana profile:
curl -fsSLO "https://github.com/horopter-dev/horopter/releases/download/$HOROPTER_VERSION/docker-compose.yaml"
docker compose --profile grafana up --detach --quiet-pull
This starts Postgres; horopter-migrate, which creates the schema and exits; bootstrap, which
issues two development keys and exits; horopter-ingress on port 8080, which records changes;
horopter-egress on port 8081, which serves them; and, from the grafana profile, Prometheus
on port 9090 and Grafana on port 3000. The ports listen on your machine only.
Wait until ingress and egress answer:
curl -fsS http://localhost:8080/readyz
curl -fsS http://localhost:8081/readyz
Install horo
horo is Horopter's command line. Install it with Homebrew, which always installs the latest
release, or the release this page pins from the release download or with Go:
Install it from Horopter's tap, on macOS or Linux. The tap always installs Horopter's latest
release, whatever HOROPTER_VERSION says:
brew install horopter-dev/tap/horoCheck the horo Homebrew installed:
"$(brew --prefix)/bin/horo" --version
test "$("$(brew --prefix)/bin/horo" --version --format bare)" = "${HOROPTER_VERSION#v}"horo v...The last line checks that the latest release is the one HOROPTER_VERSION names. It prints
nothing either way, and exits with status 1 when they differ: set HOROPTER_VERSION to the
latest release, or install the release you want from the Release download tab. brew install
leaves an installed horo as it is; brew upgrade horopter-dev/tap/horo moves it to the
latest release.
The rest of this page runs horo from your PATH.
Point horo at the Stack
horo reads where Horopter is, and which key to use, from four variables. A producer key may
record changes and nothing else; a reader key may read them and nothing else. These two are the
development keys bootstrap issued:
export HOROPTER_INGRESS_URL=http://localhost:8080
export HOROPTER_EGRESS_URL=http://localhost:8081
export HOROPTER_INGRESS_KEY=horo_dead00000001_00000000000000000000000000000000000000000000000000000000000000
export HOROPTER_EGRESS_KEY=horo_dead00000002_11111111111111111111111111111111111111111111111111111111111111
Record a Change
horo run records a command as a change: it posts the change's start, runs the command, and
posts how it ended. Here the command is a 30-second loop of reads from Horopter, there only to
give the graph something to show:
horo run --type deployment --subject demo/app --title "Deploy demo app" -- \
sh -c 'end=$(($(date +%s) + 30)); while [ "$(date +%s)" -lt "$end" ]; do horo changes --since 1m > /dev/null; done'horo: recording dev/... (horo show) — ref ... (--ref)The line names the change it recorded: dev/ and a ref that horo run made up, since you gave
it none.
See It in the Terminal
List the changes of the last hour:
horo changes --since 1h --format tableSTART...STATUS...REF...SUBJECT...TYPE...TITLE
...completed dev/... demo/app deployment.completed Deploy demo appThen show the newest change with that title, and the events it was built from:
ref=$(horo changes --since 1h | jq -rs 'map(select(.title == "Deploy demo app")) | max_by(.start) | .ref')
horo show --format table "$ref"ref: dev/...
subject: demo/app
type: deployment.completed
status: completed
title: Deploy demo app
start: ...
duration: ...
OCCURRED...TYPE...TITLE...ID
...deployment.started...Deploy demo app...
...deployment.completed...Deploy demo app...The change has a start and an end, a title, a subject and a status: completed, because the
command exited 0. It was built from two events, the start and the outcome horo run posted.
See It in Grafana
Open Grafana in your browser. The Try Horopter dashboard shows the requests per second each daemon served over the last 15 minutes, and your change as a shaded region over the spike its loop caused:
http://localhost:3000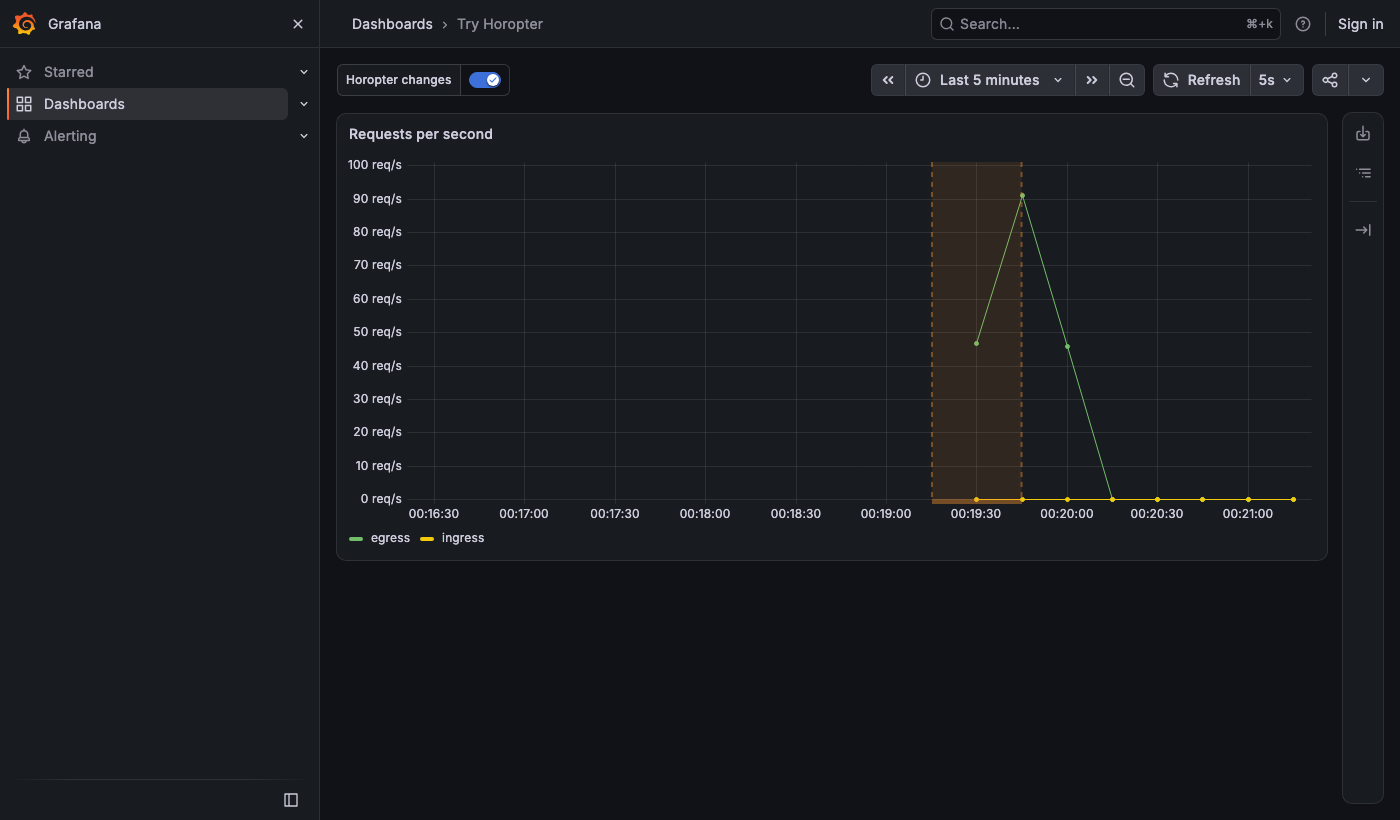
The spike outlasts the region a little because the graph is a rate over the previous 30 seconds.
The same check from the shell: wait until Grafana is up with its Infinity plugin, the plugin
the Horopter data source uses to read from egress:
curl -fsS http://localhost:3000/api/health > /dev/null
jq -e '.info.version' < <(curl -fsS http://localhost:3000/api/plugins/yesoreyeram-infinity-datasource/settings)"..."Then run the dashboard's own annotation query over the last 15 minutes, as Grafana does when it draws the dashboard, and print each change's title:
now=$(date +%s000)
curl -fsS http://localhost:3000/api/dashboards/uid/try-horopter \
  | jq --arg from "$((now - 900000))" --arg to "$now" \
    '.dashboard.annotations.list[] | select(.datasource.uid == "horopter") | {from: $from, to: $to, queries: [.target + {datasource}]}' \
  | curl -fsS -H 'Content-Type: application/json' --data @- http://localhost:3000/api/ds/query \
| jq -r '.results[].frames[] | (.schema.fields | map(.name) | index("title")) as $i | .data.values[$i][]'Deploy demo appClean Up
Stop the stack and delete its data:
docker compose --profile grafana down --volumesWhat's Next?
- Concepts: what a change is, and the three shapes it takes.
- Record your Flux deployments, and your GitHub Actions runs: their guides arrive with the public release.